
Pie charts are one of the easiest tools to add to your business presentation.
But for the love of humanity, don’t do it.
Friends don’t let friends use pie charts
Take a look at this example from a software conference (for Infor M3) I attended recently. The data isn’t all that important, but basically each country in this chart is listed with the percentage showing how many people from that country voted in a particular process:
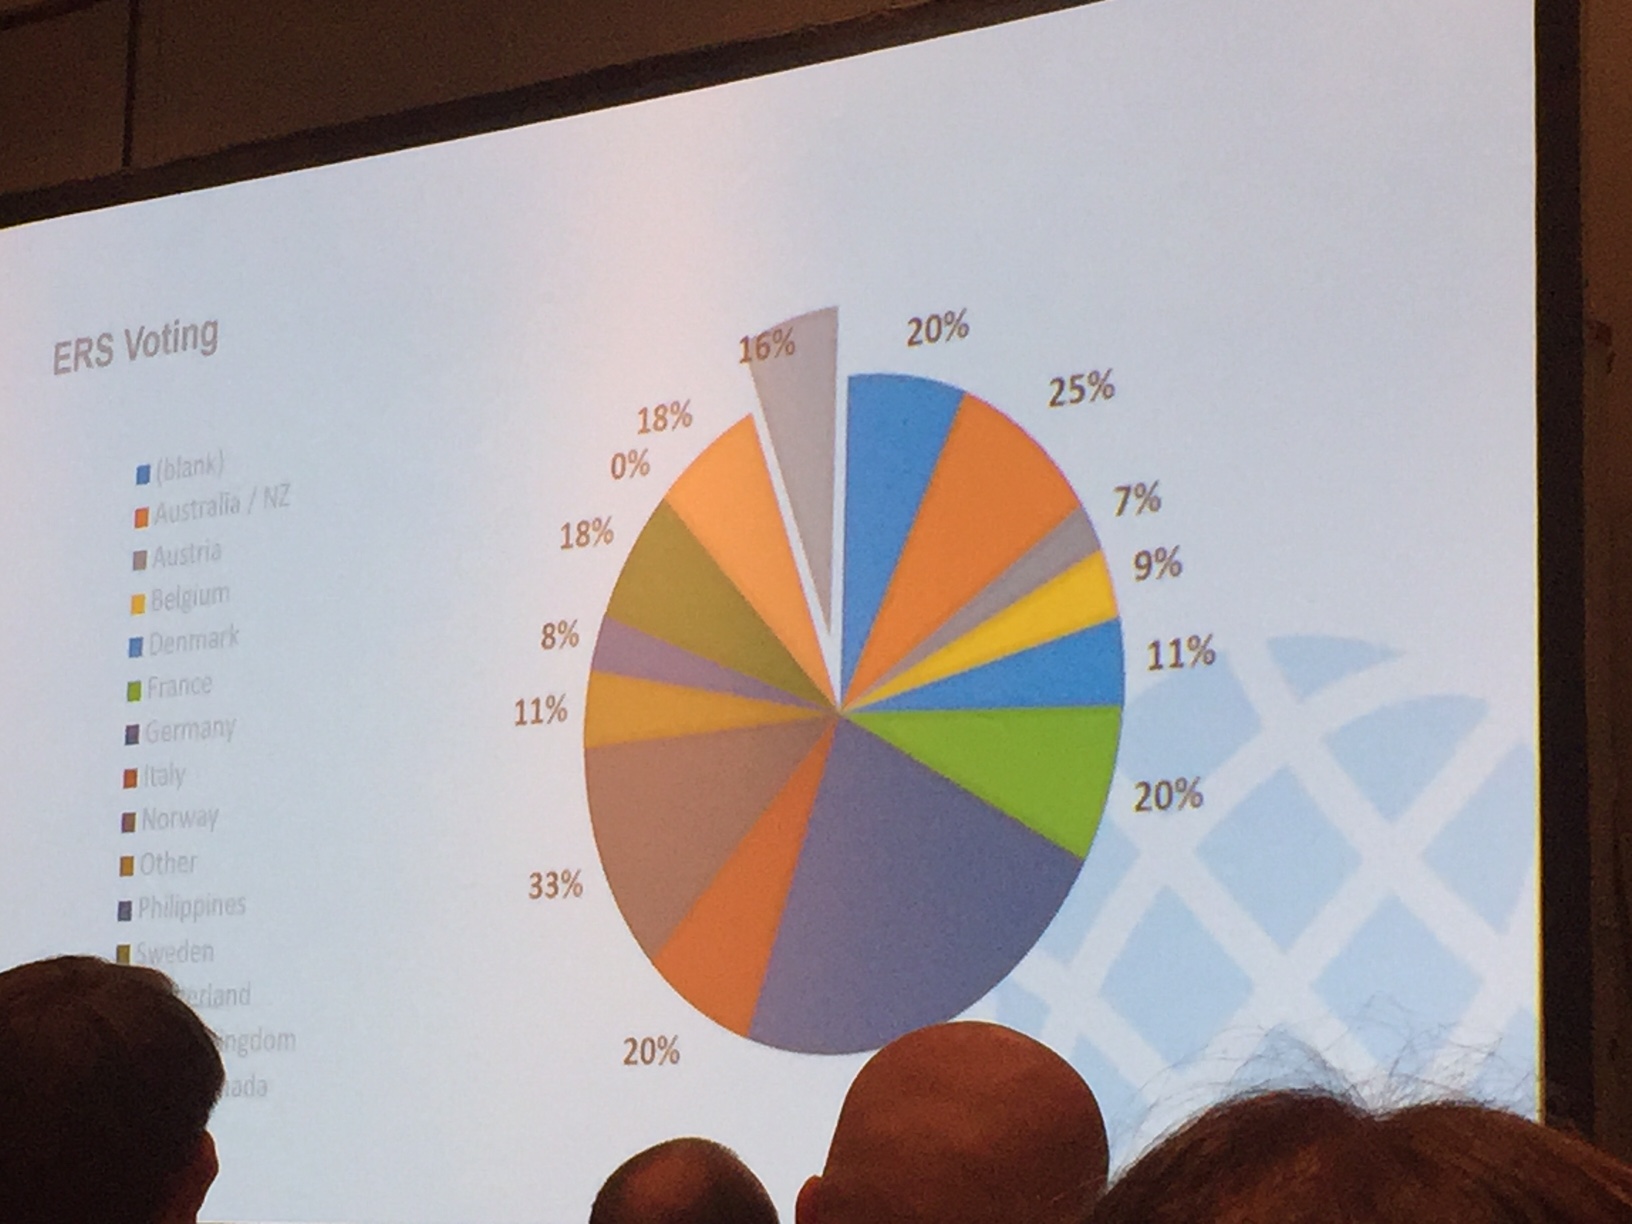
Notice anything odd?
The percentages add up to a lot more than 100%, and the pieces of the pie are arranged in an order that doesn’t help a reader understand what’s going on.
If you must use a pie chart in your presentation, you must follow some basic guidelines.
When to Use Pie Charts in a Presentation
Never.
OK, not exactly, but that’s almost true.
The basic idea, however, is that the numbers being shown in your pie chart need to represent a whole which is being divided into parts. That’s the entire metaphor of a pie chart – to show how the pie is chopped up.
Pie Chart Examples
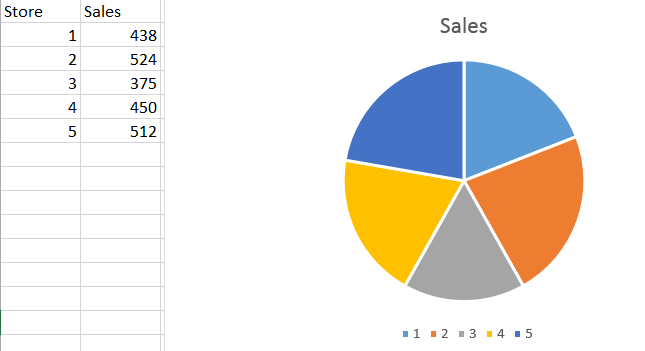
Trying to show total sales across a few different stores and how much each store contributed? Perfect!
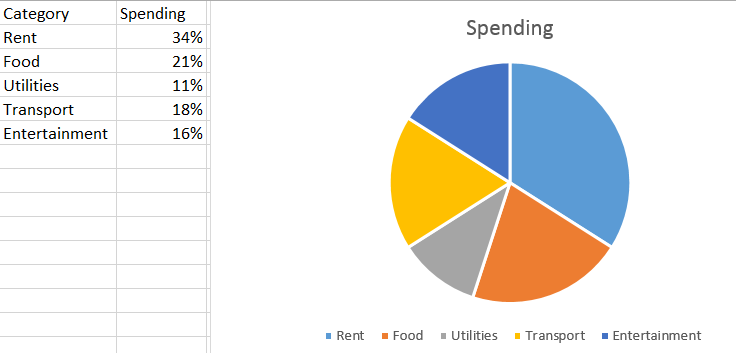
Looking at your personal spending patterns, and what percentage of spending is going into different categories? Outstanding!
If you’re presenting numbers that don’t add up to a particularly important whole, however, it makes no sense to break them up in a pie chart.
I know it’s easy to just click a couple buttons in Excel and have a nifty pie chart show up in your spreadsheet, but think really, really hard before you do it.
Chances are there’s a better way to show what you’re trying to say.
Looking for some guidance on what kind of chart to use? This article at Lifehacker can help walk you through the process.
Leave a Reply